Monitoring Logs: Grafana on macOS
I’ve been using Python’s logging library in various projects, and wanted to find a way to inspect the contents regularly (e.g. looking for counts of Warning or Error codes).
Grafana seems to be a popular option for that sort of thing, with Loki providing log aggregation and Promtail serving as the agent that collects logs. (There’s a good intro video from one of the developers.)
Installing and running Grafana locally on macOS turned out to be simple (docs). Setting up Loki and Promtail took a bit more digging through the docs, which are not very well organized.
Setup Grafana
With Homebrew (after brew update to get the latest version on macOS Big Sur):
brew install grafana
To start / stop / restart as a background service:
brew services start grafana
The default local URL for Grafana is localhost:3000
Setup Loki
The canonical tool for aggregating logs into Grafana seems to be Loki (along with some process to send logs to Loki). Loki has an API that can be used, among other things, by a log handler in Python’s logging (example. But for existing files, Promtail is the tool written by the Loki folks.
The Loki docs list a bunch of options for installation, but Homebrew seems to work just fine for a simple local install.
brew install loki
… and same as Grafana, Loki can be managed as a background process:
brew services start loki
… or started directly with the --config.file flag:
loki --config.file=loki-local-config.yaml
The docs provide a version of the default local config that didn’t work for me, apparnetly due to the link pointing to master branch instead of the latest rlease; this version worked.
As verifification that Loki is running (assuming default URL config), the localhost:3100/readyendpoint should return the string ready`.
Once Loki is started, it can be configured as a datasource in the Grafana GUI. It took me a while to realize that the value of http://localhost:3100 in the URL config was just a default hint, and needed to be typed in manually.
Setup Promtail
Promtail is the agent that collects logs and sends them to Logi for aggregation.
brew install promtail
Similar to Loki, Promtail needs to be started with a config file:
promtail --config.file=promtail-local-config.yaml
The Promtail docs are… missing a simple tutorial? But there is a sample config file that can be used as a starting point.
At this point, it should be possible to get some raw log data into a Grafana dashboard, using Loki as a datasource. But it’s not very useful without speciying some log processing and aggregation logic.
Log Processing
Promtail ships with a processing pipeline.
Given a simple log like the below, we want to at least parse out the different fields from the logstring.
2021-02-19 14:41:53,415 - INFO - Query executed: SELECT sql FROM sqlite_master WHERE type="table" and name="JobRuns"
2021-02-19 14:41:53,418 - INFO - Insertion to JobRuns executed: INSERT INTO JobRuns(datetime,jobId,name,status) VALUES (?,?,?,?)
2021-02-19 14:41:53,419 - INFO - Closed DB conn.
A complete Promtail config is below, with some inline comments for the piepeline stages.
- supported regex grammar is RE2
- timestamp formatting is in the somewhat idiosyncratic Go style
server:
  http_listen_port: 9080
  grpc_listen_port: 0

positions:
  filename: /Users/tarokuriyama/logs/positions.yaml

clients:
  - url: http://127.0.0.1:3100/loki/api/v1/push

scrape_configs:
  - job_name: all_logs
    pipeline_stages:
      - match:
          selector: '{job="all_logs"}'
          stages:
            # capture "timestamp", "level", "module", "msg" fields
            - regex:
                expression: '(?P<timestamp>[\d-]+ [\d:]+),[\d]+ - (?P<level>[A-Z]+) - (?P<module>[A-Za-z_.]+) - (?P<msg>.*)'
            # promote "level" and "module" to labels
            - labels:
                level:
                module:
            # specify the timestamp format and source field
            - timestamp:
                format: '2006-01-02 03:04:05'
                source: timestamp
            # specify value of output body per log message
            - output:
                source: msg
    static_configs:
    - targets:
        - localhost
      labels:
        job: all_logs
        __path__: /Users/tarokuriyama/logs/*.log
The filename is also a field that’s captured at some point by Promtail, but I couldn’t figure how to parse it for labeling, or format it for display purposes (in my case, I only want the filename, not the full path). So I ended up making the logs a bit more verbose, and the filename is captured by the module field name in regex above:
2021-02-21 06:43:48,086 - INFO - datautils.core.db_lib - Closed DB conn.
Since we have to work with YAML config files, it’s quite helpful to be able to see output directly in a shell (without needing to go to Loki / Grafana, where the GUI obscures the raw output). To read from stdin and have no side effects on the positions.yaml file that Promtail uses to track read positions in log files:
cat ~/logs/datautils.core.db_lib.log | promtail --config.file=promtail-local-config.yaml --dry-run --stdin
Tying it Together
Start services:
brew services start grafana
brew services start loki
promtail --config.file=promtail-local-config.yaml
… and the rest is GUI configuration in Grafana.
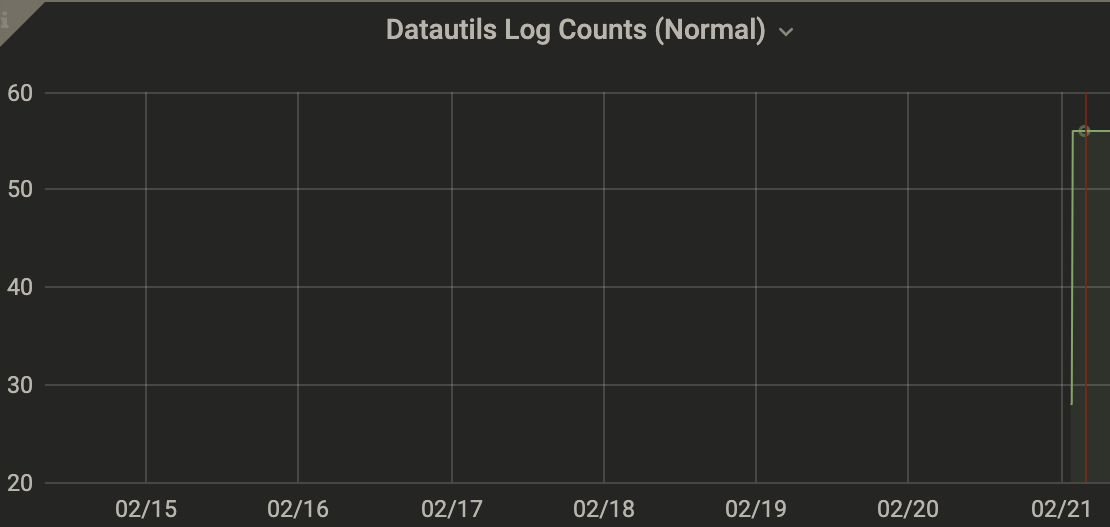
In my case, I have LogQL expressions like this:
sum( count_over_time({job="all_logs", module=~"datautils.*", level=~"(DEBUG|INFO)"}[1d]) )
… which produces a simple timeseries like this: